Pyecharts库的学习历程:绘制动态排行榜
2 min read
Page Views
1.原始数据
2002~2021年地区生产总值(亿元) 数据如下所示:
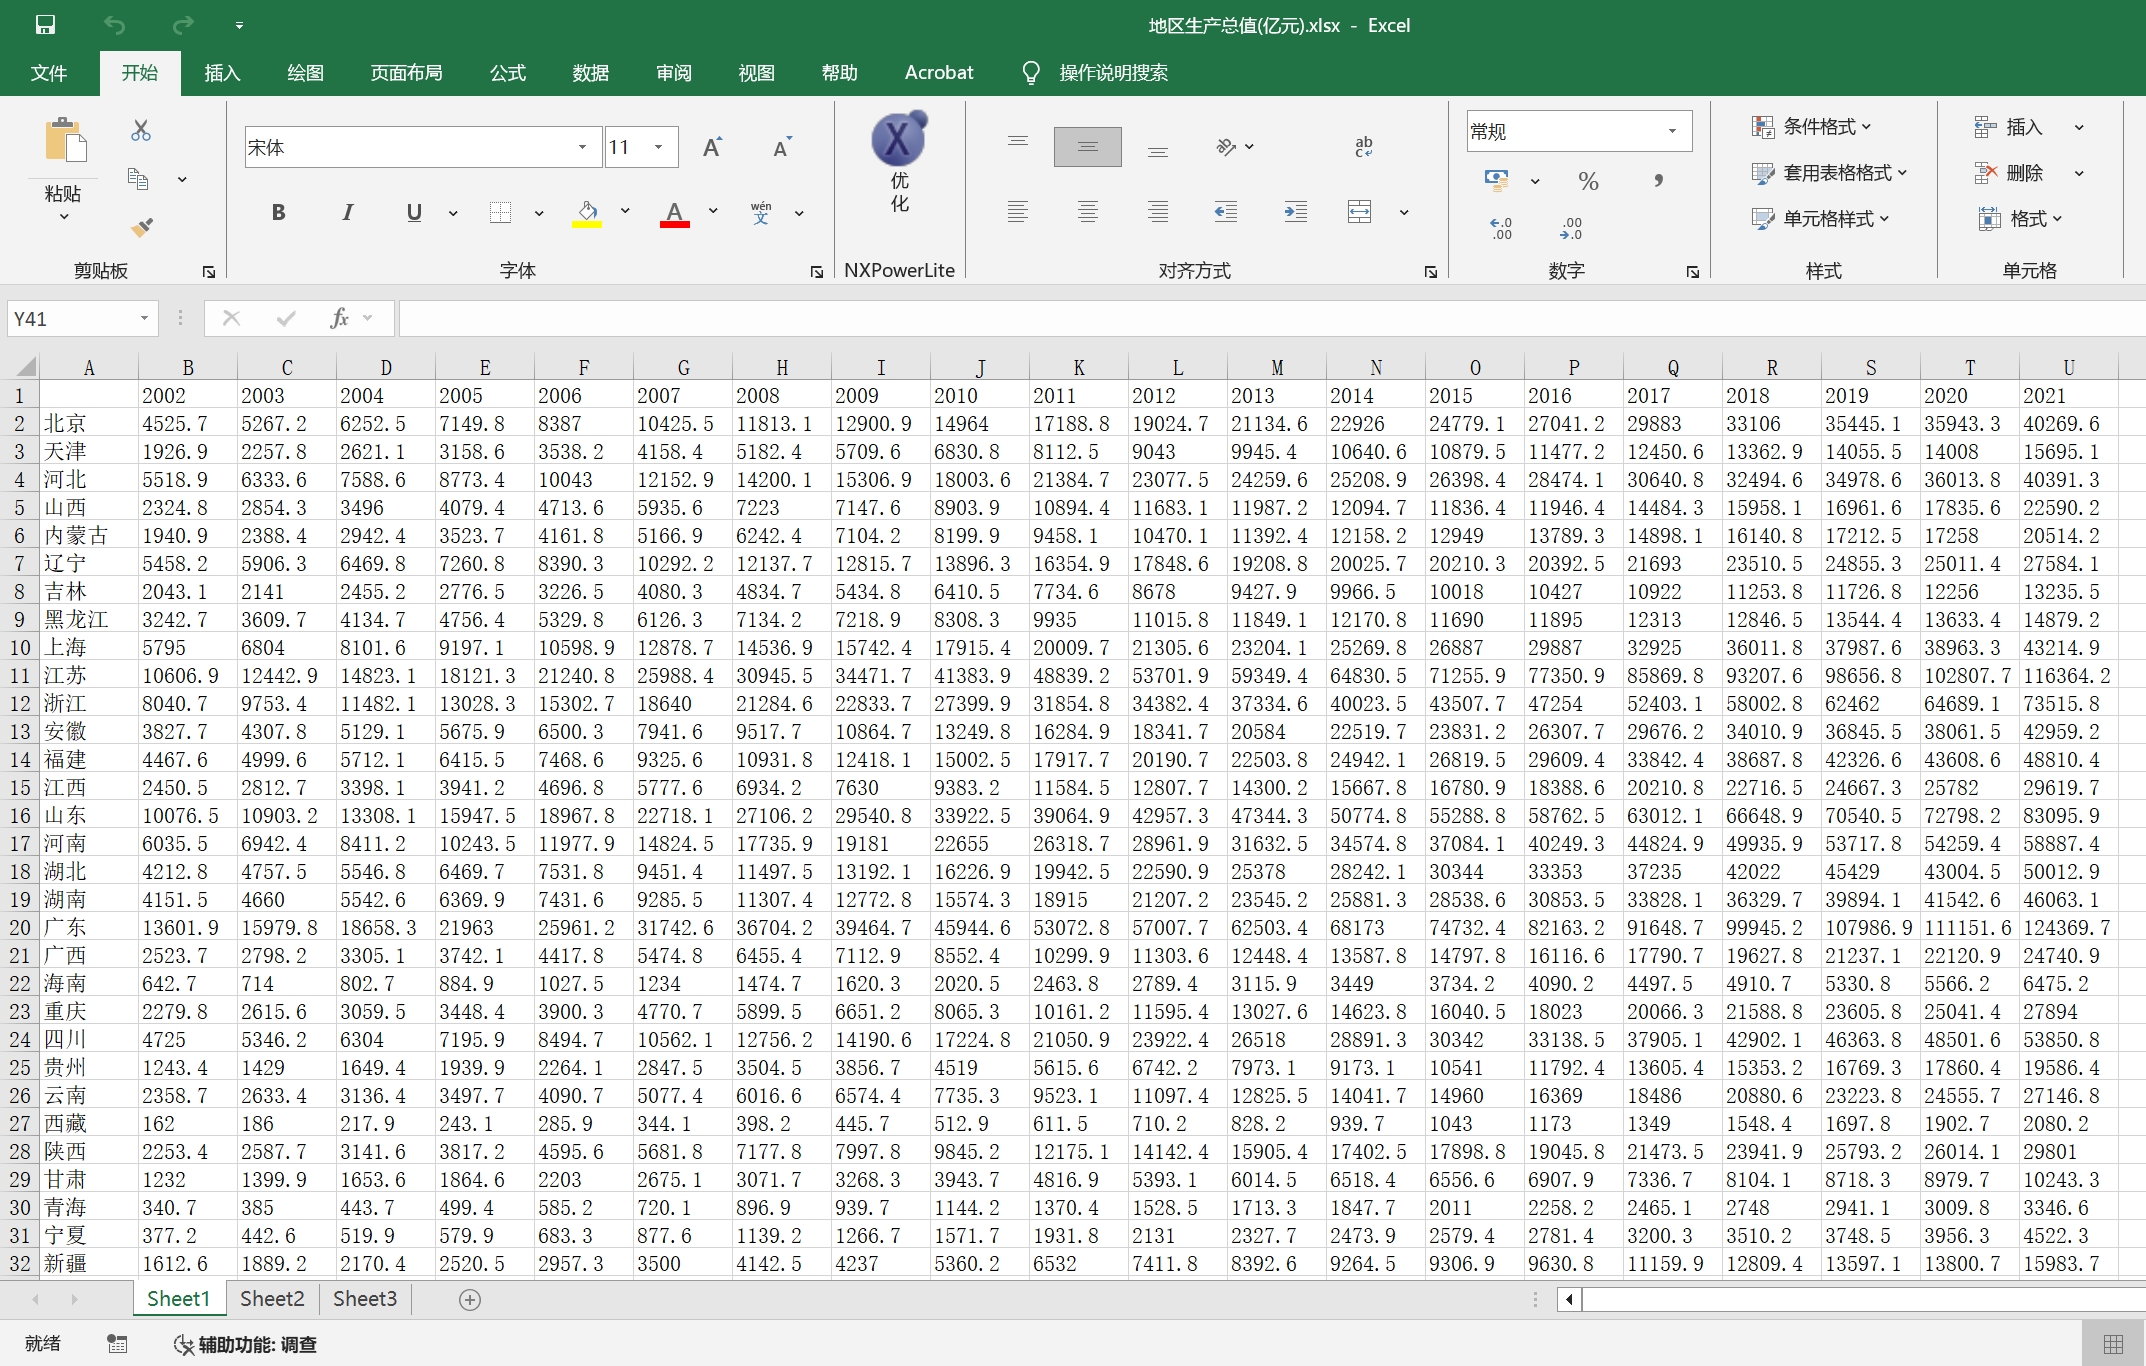
数据下载地址:
https://data.stats.gov.cn/easyquery.htm?cn=E0103
2.python程序
import pandas as pd
from pyecharts.charts import Bar
from pyecharts import options as opts
from pyecharts.charts import Timeline
import random

"""
pandas: 1.5.3
pyecharts: 2.0.6
"""

data = pd.read_excel('地区生产总值(亿元).xlsx', sheet_name='Sheet1', index_col=0)
year = list(data.columns)
x = list(data.index)

timeline = Timeline()
for i in range(len(year)):
    xy = list(zip(x, data.iloc[:, i]))
    xy.sort(key=lambda x: x[1], reverse=False)
    xy = xy[-10:]

    bar = Bar()
    bar.add_xaxis(xaxis_data=[i[0] for i in xy])
    bar.add_yaxis(series_name=str(year[i]) + '年地区生产总值', y_axis=[i[1] for i in xy])
    bar.reversal_axis()
    bar.set_global_opts(xaxis_opts=opts.AxisOpts(splitline_opts=opts.SplitLineOpts(is_show=True),
                                                 axislabel_opts=opts.LabelOpts(is_show=True)),
                        yaxis_opts=opts.AxisOpts(splitline_opts=opts.SplitLineOpts(is_show=True),
                                                 axislabel_opts=opts.LabelOpts(is_show=True)),
                        title_opts=opts.TitleOpts(title='地区生产总值排行榜(%s年)' % str(year[i]), subtitle='单位:亿元',
                                                  pos_left='center', pos_top='top'),
                        legend_opts=opts.LegendOpts(is_show=False),
                        visualmap_opts=opts.VisualMapOpts(
                            is_show=False, pos_top='center', range_color=['lightskyblue', 'yellow', 'orangered'],
                            min_=0, max_=10),
                        )
    bar.set_series_opts(label_opts=opts.LabelOpts(is_show=True, position='right', color='red'))
    timeline.add(bar, year[i]).add_schema(is_auto_play=True)
timeline.render('动态排行榜一.html')
3.效果展示

Last updated on 2025-05-18