Statsmodels库的学习历程:基于ARIMA模型进行时序分析
9 min read
Page Views
1.原始数据
2020年的LBMA黄金价格数据如下所示:
| Date | USD (PM) |
|---|---|
| 2020/01/02 | 1527.10 |
| 2020/01/03 | 1548.75 |
| 2020/01/06 | 1573.10 |
| 2020/01/07 | 1567.85 |
| 2020/01/08 | 1571.95 |
| 2020/01/09 | 1550.75 |
| 2020/01/10 | 1553.60 |
| 2020/01/13 | 1549.90 |
| 2020/01/14 | 1545.10 |
| 2020/01/15 | 1549.00 |
| 2020/01/16 | 1554.55 |
| 2020/01/17 | 1557.60 |
| 2020/01/20 | 1560.15 |
| 2020/01/21 | 1551.30 |
| 2020/01/22 | 1556.90 |
| 2020/01/23 | 1562.90 |
| 2020/01/24 | 1564.30 |
| 2020/01/27 | 1580.10 |
| 2020/01/28 | 1574.00 |
| 2020/01/29 | 1573.45 |
| 2020/01/30 | 1578.25 |
| 2020/01/31 | 1584.20 |
| 2020/02/03 | 1574.75 |
| 2020/02/04 | 1558.35 |
| 2020/02/05 | 1553.30 |
| 2020/02/06 | 1563.30 |
| 2020/02/07 | 1572.65 |
| 2020/02/10 | 1573.20 |
| 2020/02/11 | 1570.50 |
| 2020/02/12 | 1563.70 |
| 2020/02/13 | 1575.05 |
| 2020/02/14 | 1581.40 |
| 2020/02/17 | 1580.80 |
| 2020/02/18 | 1589.85 |
| 2020/02/19 | 1604.20 |
| 2020/02/20 | 1619.00 |
| 2020/02/21 | 1643.30 |
| 2020/02/24 | 1671.65 |
| 2020/02/25 | 1650.30 |
| 2020/02/26 | 1634.90 |
| 2020/02/27 | 1652.00 |
| 2020/02/28 | 1609.85 |
| 2020/03/02 | 1599.65 |
| 2020/03/03 | 1615.50 |
| 2020/03/04 | 1641.85 |
| 2020/03/05 | 1659.60 |
| 2020/03/06 | 1683.65 |
| 2020/03/09 | 1672.50 |
| 2020/03/10 | 1655.70 |
| 2020/03/11 | 1653.75 |
| 2020/03/12 | 1570.70 |
| 2020/03/13 | 1562.80 |
| 2020/03/16 | 1487.70 |
| 2020/03/17 | 1536.20 |
| 2020/03/18 | 1498.20 |
| 2020/03/19 | 1474.25 |
| 2020/03/20 | 1494.40 |
| 2020/03/23 | 1525.40 |
| 2020/03/24 | 1605.75 |
| 2020/03/25 | 1605.45 |
| 2020/03/26 | 1634.80 |
| 2020/03/27 | 1617.30 |
| 2020/03/30 | 1618.30 |
| 2020/03/31 | 1608.95 |
| 2020/04/01 | 1576.55 |
| 2020/04/02 | 1616.80 |
| 2020/04/03 | 1613.10 |
| 2020/04/06 | 1648.30 |
| 2020/04/07 | 1649.25 |
| 2020/04/08 | 1647.80 |
| 2020/04/09 | 1680.65 |
| 2020/04/14 | 1741.90 |
| 2020/04/15 | 1718.65 |
| 2020/04/16 | 1729.50 |
| 2020/04/17 | 1692.55 |
| 2020/04/20 | 1686.20 |
| 2020/04/21 | 1682.05 |
| 2020/04/22 | 1710.55 |
| 2020/04/23 | 1736.25 |
| 2020/04/24 | 1715.90 |
| 2020/04/27 | 1714.95 |
| 2020/04/28 | 1691.55 |
| 2020/04/29 | 1703.35 |
| 2020/04/30 | 1702.75 |
| 2020/05/01 | 1686.25 |
| 2020/05/04 | 1709.10 |
| 2020/05/05 | 1699.55 |
| 2020/05/06 | 1691.50 |
| 2020/05/07 | 1704.05 |
| 2020/05/11 | 1702.75 |
| 2020/05/12 | 1702.40 |
| 2020/05/13 | 1708.40 |
| 2020/05/14 | 1731.60 |
| 2020/05/15 | 1735.35 |
| 2020/05/18 | 1734.70 |
| 2020/05/19 | 1737.95 |
| 2020/05/20 | 1748.30 |
| 2020/05/21 | 1724.90 |
| 2020/05/22 | 1733.55 |
| 2020/05/26 | 1720.25 |
| 2020/05/27 | 1694.60 |
| 2020/05/28 | 1717.35 |
| 2020/05/29 | 1728.70 |
| 2020/06/01 | 1730.60 |
| 2020/06/02 | 1742.15 |
| 2020/06/03 | 1705.35 |
| 2020/06/04 | 1700.05 |
| 2020/06/05 | 1683.45 |
| 2020/06/08 | 1690.35 |
| 2020/06/09 | 1713.50 |
| 2020/06/10 | 1722.05 |
| 2020/06/11 | 1738.25 |
| 2020/06/12 | 1733.50 |
| 2020/06/15 | 1710.45 |
| 2020/06/16 | 1719.85 |
| 2020/06/17 | 1724.35 |
| 2020/06/18 | 1719.50 |
| 2020/06/19 | 1734.75 |
| 2020/06/22 | 1761.85 |
| 2020/06/23 | 1768.90 |
| 2020/06/24 | 1766.05 |
| 2020/06/25 | 1756.55 |
| 2020/06/26 | 1747.60 |
| 2020/06/29 | 1771.60 |
| 2020/06/30 | 1768.10 |
| 2020/07/01 | 1771.05 |
| 2020/07/02 | 1777.45 |
| 2020/07/03 | 1772.90 |
| 2020/07/06 | 1787.90 |
| 2020/07/07 | 1789.55 |
| 2020/07/08 | 1811.10 |
| 2020/07/09 | 1812.10 |
| 2020/07/10 | 1803.10 |
| 2020/07/13 | 1807.50 |
| 2020/07/14 | 1801.90 |
| 2020/07/15 | 1804.60 |
| 2020/07/16 | 1807.70 |
| 2020/07/17 | 1807.35 |
| 2020/07/20 | 1815.65 |
| 2020/07/21 | 1842.55 |
| 2020/07/22 | 1852.40 |
| 2020/07/23 | 1878.30 |
| 2020/07/24 | 1902.10 |
| 2020/07/27 | 1936.65 |
| 2020/07/28 | 1940.90 |
| 2020/07/29 | 1950.90 |
| 2020/07/30 | 1957.65 |
| 2020/07/31 | 1964.90 |
| 2020/08/03 | 1958.55 |
| 2020/08/04 | 1977.90 |
| 2020/08/05 | 2048.15 |
| 2020/08/06 | 2067.15 |
| 2020/08/07 | 2031.15 |
| 2020/08/10 | 2044.50 |
| 2020/08/11 | 1939.65 |
| 2020/08/12 | 1931.90 |
| 2020/08/13 | 1944.25 |
| 2020/08/14 | 1944.75 |
| 2020/08/17 | 1972.85 |
| 2020/08/18 | 2008.75 |
| 2020/08/19 | 1981.00 |
| 2020/08/20 | 1927.15 |
| 2020/08/21 | 1924.35 |
| 2020/08/24 | 1943.95 |
| 2020/08/25 | 1911.15 |
| 2020/08/26 | 1932.95 |
| 2020/08/27 | 1923.85 |
| 2020/08/28 | 1957.35 |
| 2020/09/01 | 1972.35 |
| 2020/09/02 | 1947.05 |
| 2020/09/03 | 1940.45 |
| 2020/09/04 | 1926.30 |
| 2020/09/07 | 1928.45 |
| 2020/09/08 | 1910.95 |
| 2020/09/09 | 1947.20 |
| 2020/09/10 | 1966.25 |
| 2020/09/11 | 1947.40 |
| 2020/09/14 | 1958.70 |
| 2020/09/15 | 1949.35 |
| 2020/09/16 | 1961.80 |
| 2020/09/17 | 1936.25 |
| 2020/09/18 | 1950.85 |
| 2020/09/21 | 1909.35 |
| 2020/09/22 | 1906.00 |
| 2020/09/23 | 1873.40 |
| 2020/09/24 | 1861.75 |
| 2020/09/25 | 1859.70 |
| 2020/09/28 | 1864.30 |
| 2020/09/29 | 1883.95 |
| 2020/09/30 | 1886.90 |
| 2020/10/01 | 1902.00 |
| 2020/10/02 | 1903.05 |
| 2020/10/05 | 1909.60 |
| 2020/10/06 | 1913.40 |
| 2020/10/07 | 1884.50 |
| 2020/10/08 | 1887.45 |
| 2020/10/09 | 1923.25 |
| 2020/10/12 | 1925.50 |
| 2020/10/13 | 1891.30 |
| 2020/10/14 | 1910.05 |
| 2020/10/15 | 1891.90 |
| 2020/10/16 | 1905.05 |
| 2020/10/19 | 1905.60 |
| 2020/10/20 | 1898.40 |
| 2020/10/21 | 1924.15 |
| 2020/10/22 | 1900.95 |
| 2020/10/23 | 1903.65 |
| 2020/10/26 | 1898.45 |
| 2020/10/27 | 1905.70 |
| 2020/10/28 | 1869.95 |
| 2020/10/29 | 1870.30 |
| 2020/10/30 | 1881.85 |
| 2020/11/02 | 1889.90 |
| 2020/11/03 | 1908.30 |
| 2020/11/04 | 1900.15 |
| 2020/11/05 | 1938.45 |
| 2020/11/06 | 1940.80 |
| 2020/11/09 | 1867.30 |
| 2020/11/10 | 1878.70 |
| 2020/11/11 | 1860.95 |
| 2020/11/12 | 1874.85 |
| 2020/11/13 | 1890.90 |
| 2020/11/16 | 1885.60 |
| 2020/11/17 | 1889.05 |
| 2020/11/18 | 1876.10 |
| 2020/11/19 | 1857.35 |
| 2020/11/20 | 1875.70 |
| 2020/11/23 | 1840.20 |
| 2020/11/24 | 1799.60 |
| 2020/11/25 | 1810.20 |
| 2020/11/26 | 1807.40 |
| 2020/11/27 | 1779.30 |
| 2020/11/30 | 1762.55 |
| 2020/12/01 | 1810.75 |
| 2020/12/02 | 1822.60 |
| 2020/12/03 | 1832.35 |
| 2020/12/04 | 1843.00 |
| 2020/12/07 | 1859.95 |
| 2020/12/08 | 1868.15 |
| 2020/12/09 | 1841.75 |
| 2020/12/10 | 1844.35 |
| 2020/12/11 | 1842.00 |
| 2020/12/14 | 1831.15 |
| 2020/12/15 | 1850.65 |
| 2020/12/16 | 1851.95 |
| 2020/12/17 | 1890.75 |
| 2020/12/18 | 1879.75 |
| 2020/12/21 | 1880.00 |
| 2020/12/22 | 1877.10 |
| 2020/12/23 | 1875.00 |
| 2020/12/29 | 1874.30 |
| 2020/12/30 | 1887.60 |
2.python程序
import numpy as np
import pandas as pd
from datetime import datetime, timedelta
import statsmodels.api as sm
from arch.unitroot import ADF
from statsmodels.stats.diagnostic import acorr_ljungbox
from statsmodels.graphics.tsaplots import plot_acf, plot_pacf
from sklearn.metrics import explained_variance_score, mean_absolute_error, mean_squared_error, r2_score
import matplotlib.pyplot as plt
import warnings
warnings.filterwarnings('ignore')
plt.rcParams['font.sans-serif'] = ['SimSun']
plt.rcParams['axes.unicode_minus'] = False
plt.rc('axes', unicode_minus=False)
dateparse = lambda dates: pd.datetime.strptime(dates, '%Y-%m-%d')
data = pd.read_excel(io='LBMA-GOLD.xlsx', sheet_name='Sheet1', index_col=0, date_parser=dateparse)
print(data)
train = data.iloc[:200, :]
test = data.iloc[200:, :]
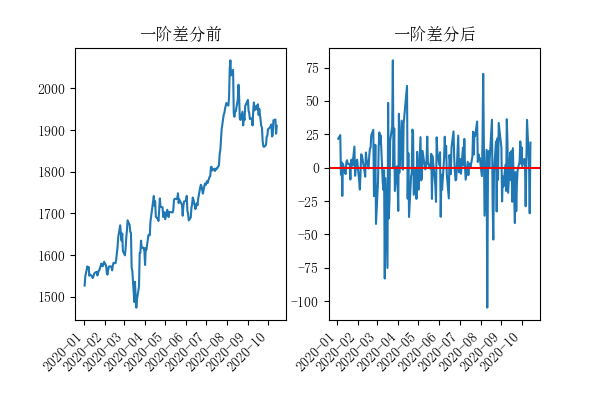
print('\n平稳性检验:\n', ADF(train['USD (PM)'], trend='n'))
train['USD-DIFF (PM)'] = train['USD (PM)'].diff(1)
print('\n一阶差分后平稳性检验:\n', ADF(train['USD-DIFF (PM)'].dropna(), trend='n'))
fig, ax = plt.subplots(nrows=1, ncols=2, figsize=(6, 4))
ax[0].plot(train['USD (PM)'])
ax[0].set_title('一阶差分前')
ax[1].plot(train['USD-DIFF (PM)'])
ax[1].axhline(0, color='red')
ax[1].set_title('一阶差分后')
fig.autofmt_xdate(rotation=45)
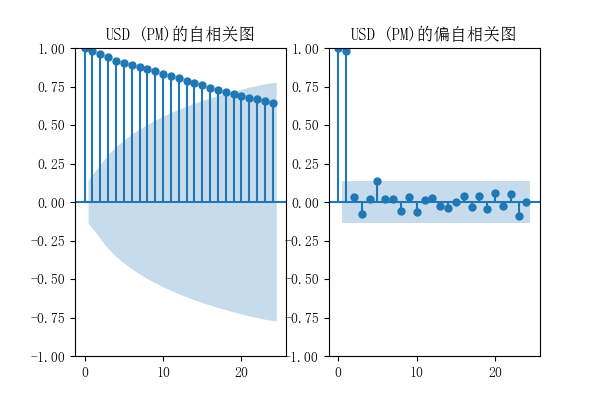
print('\n白噪声检验:\n', acorr_ljungbox(train['USD (PM)'], lags=20, boxpierce=True))
fig, ax = plt.subplots(nrows=1, ncols=2, figsize=(6, 4))
plot_acf(train['USD (PM)'], ax=ax[0], title='USD (PM)的自相关图')
plot_pacf(train['USD (PM)'], ax=ax[1], method='ywm', title='USD (PM)的偏自相关图')
trend = sm.tsa.arma_order_select_ic(train['USD (PM)'], ic=['aic'], trend='n', max_ar=10, max_ma=10)
d = 1
p = trend.aic_min_order[0]
q = trend.aic_min_order[1]
print(f'\np值:{p},d值:{d},q值:{q}')
start_date = datetime(year=2021, month=1, day=1)
end_date = datetime(year=2021, month=1, day=31)
date_list = []
current_date = start_date
while current_date <= end_date:
date_list.append(current_date.strftime('%Y-%m-%d'))
current_date += timedelta(days=1)
history = [x for x in train['USD (PM)']]
predictions = list()
model = sm.tsa.ARIMA(history, order=(p, d, q), trend='t')
model_fit = model.fit()
print(model_fit.summary())
yhat = model_fit.forecast()[0]
predictions.append(yhat)
history.append(test['USD (PM)'][0])
for i in range(1, len(test['USD (PM)'])):
model = sm.tsa.ARIMA(history, order=(p, d, q), trend='t')
model_fit = model.fit()
yhat = model_fit.forecast()[0]
predictions.append(yhat)
obs = test['USD (PM)'][i]
history.append(obs)
forecast = model_fit.forecast(steps=len(date_list))
forecast = pd.DataFrame(forecast, index=date_list)
forecast.columns = ['forecast']
forecast.index = pd.to_datetime(forecast.index.values, format='%Y-%m-%d')
print('\n未来一月预测数据:\n', forecast)
ev = explained_variance_score(test['USD (PM)'], predictions)
print(f'\nEV: {ev}')
r2 = r2_score(test['USD (PM)'], predictions)
print(f'R2: {r2}')
mse = mean_squared_error(test['USD (PM)'], predictions)
print(f'MSE: {mse}')
mae = mean_absolute_error(test['USD (PM)'], predictions)
print(f'MAE: {mae}')
rmse = np.sqrt(mean_squared_error(test['USD (PM)'], predictions))
print(f'RMSE: {rmse}')
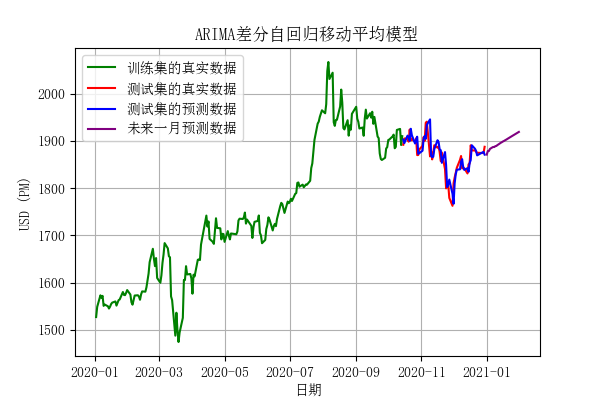
plt.figure(figsize=(6, 4))
plt.plot(train.index, train['USD (PM)'], color='green', label='训练集的真实数据')
plt.plot(test.index, test['USD (PM)'], color='red', label='测试集的真实数据')
plt.plot(test.index, predictions, color='blue', label='测试集的预测数据')
plt.plot(forecast.index, forecast['forecast'], color='purple', label='未来一月预测数据')
plt.title('ARIMA差分自回归移动平均模型')
plt.xlabel('日期')
plt.ylabel('USD (PM)')
plt.legend()
plt.grid(True)
plt.show()
3.效果展示
            USD (PM)
Date
2020-01-02   1527.10
2020-01-03   1548.75
2020-01-06   1573.10
2020-01-07   1567.85
2020-01-08   1571.95
...              ...
2020-12-21   1880.00
2020-12-22   1877.10
2020-12-23   1875.00
2020-12-29   1874.30
2020-12-30   1887.60

[252 rows x 1 columns]

平稳性检验:
    Augmented Dickey-Fuller Results
=====================================
Test Statistic                  1.148
P-value                         0.935
Lags                                4
-------------------------------------

Trend: No Trend
Critical Values: -2.58 (1%), -1.94 (5%), -1.62 (10%)
Null Hypothesis: The process contains a unit root.
Alternative Hypothesis: The process is weakly stationary.

一阶差分后平稳性检验:
    Augmented Dickey-Fuller Results
=====================================
Test Statistic                 -8.286
P-value                         0.000
Lags                                3
-------------------------------------

Trend: No Trend
Critical Values: -2.58 (1%), -1.94 (5%), -1.62 (10%)
Null Hypothesis: The process contains a unit root.
Alternative Hypothesis: The process is weakly stationary.

白噪声检验:
         lb_stat      lb_pvalue      bp_stat      bp_pvalue
1    194.759300   2.907665e-44   191.866835   1.244089e-43
2    383.039338   6.669059e-84   376.418556   1.827045e-82
3    563.783268  7.149624e-122   552.688626  1.816158e-119
4    737.656023  2.443597e-158   721.396844  8.109841e-155
5    906.832548  8.838113e-194   884.710816  5.419758e-189
6   1071.632944  2.860791e-228  1042.984463  4.507469e-222
7   1232.762834  5.804458e-262  1196.935299  3.248199e-254
8   1389.389918  1.114091e-294  1345.808567  2.944619e-285
9   1541.943662   0.000000e+00  1490.054929   0.000000e+00
10  1689.339573   0.000000e+00  1628.694647   0.000000e+00
11  1831.981022   0.000000e+00  1762.156201   0.000000e+00
12  1970.413004   0.000000e+00  1890.993887   0.000000e+00
13  2104.407330   0.000000e+00  2015.038139   0.000000e+00
14  2233.977639   0.000000e+00  2134.345454   0.000000e+00
15  2359.136348   0.000000e+00  2248.971004   0.000000e+00
16  2480.469071   0.000000e+00  2359.491900   0.000000e+00
17  2597.650304   0.000000e+00  2465.651136   0.000000e+00
18  2711.573499   0.000000e+00  2568.294807   0.000000e+00
19  2821.623435   0.000000e+00  2666.903907   0.000000e+00
20  2928.638565   0.000000e+00  2762.263925   0.000000e+00

p值:8,d值:1,q值:2
                               SARIMAX Results
==============================================================================
Dep. Variable:                      y   No. Observations:                  200
Model:                 ARIMA(8, 1, 2)   Log Likelihood                -893.488
Date:                Wed, 16 Jul 2025   AIC                           1810.977
Time:                        23:21:30   BIC                           1850.496
Sample:                             0   HQIC                          1826.971
                                - 200
Covariance Type:                  opg
==============================================================================
                 coef    std err          z      P>|z|      [0.025      0.975]
------------------------------------------------------------------------------
x1             1.8702      1.320      1.417      0.157      -0.717       4.457
ar.L1         -0.8557      0.274     -3.122      0.002      -1.393      -0.319
ar.L2         -0.6625      0.253     -2.621      0.009      -1.158      -0.167
ar.L3          0.0196      0.105      0.186      0.853      -0.187       0.226
ar.L4         -0.1510      0.083     -1.817      0.069      -0.314       0.012
ar.L5         -0.2805      0.113     -2.484      0.013      -0.502      -0.059
ar.L6         -0.2744      0.132     -2.078      0.038      -0.533      -0.016
ar.L7         -0.0822      0.094     -0.874      0.382      -0.267       0.102
ar.L8         -0.1233      0.076     -1.615      0.106      -0.273       0.026
ma.L1          0.8469      0.271      3.120      0.002       0.315       1.379
ma.L2          0.7820      0.262      2.989      0.003       0.269       1.295
sigma2       460.8317     33.910     13.590      0.000     394.370     527.294
===================================================================================
Ljung-Box (L1) (Q):                   0.01   Jarque-Bera (JB):                71.88
Prob(Q):                              0.94   Prob(JB):                         0.00
Heteroskedasticity (H):               1.25   Skew:                            -0.52
Prob(H) (two-sided):                  0.36   Kurtosis:                         5.75
===================================================================================

Warnings:
[1] Covariance matrix calculated using the outer product of gradients (complex-step).

未来一月预测数据:
                forecast
2021-01-01  1871.011736
2021-01-02  1878.637793
2021-01-03  1878.726825
2021-01-04  1883.143770
2021-01-05  1884.582227
2021-01-06  1886.011839
2021-01-07  1887.258044
2021-01-08  1887.077311
2021-01-09  1888.905537
2021-01-10  1889.423383
2021-01-11  1891.339065
2021-01-12  1892.732772
2021-01-13  1894.369534
2021-01-14  1895.980334
2021-01-15  1897.192566
2021-01-16  1898.699916
2021-01-17  1899.826056
2021-01-18  1901.236044
2021-01-19  1902.518871
2021-01-20  1903.909368
2021-01-21  1905.330258
2021-01-22  1906.697727
2021-01-23  1908.135360
2021-01-24  1909.480316
2021-01-25  1910.875230
2021-01-26  1912.223809
2021-01-27  1913.591264
2021-01-28  1914.962440
2021-01-29  1916.327573
2021-01-30  1917.713328
2021-01-31  1919.083121

EV: 0.6777102452348833
R2: 0.6737551295319617
MSE: 448.0266135387967
MAE: 14.968920039737192
RMSE: 21.166639164940587
Last updated on 2025-06-27